Design for IoT weather stations
Design a web-based application for SPOT, an IoT weather system, to manage data and devices.
Problem
As SPOT stations collect weather data in the field, we want to explore how the data and other weather services can help users make operational decisions for their businesses? How can users manage multiple weather stations more efficiently?
Solution
Create a web-based application to provide users with historical and real-time weather data that they can use to make operational decisions.
Make data dashboard for collaborative teams to manage multiple devices more efficiently.
Hyper-local weather nowcast and cloud coverage services will be added in the near future.
My role
Conduct user research with the marketing team
Define features and workflows
Build info architecture
Design and iterate wireframes
Create hi-fidelity prototypes
Conduct field and usability tests
Create design specs for implementation
Manage product development
Collaborate with
Marketing team
Back-end & Front-end engineers
Data analysts
Meteorologists
Duration
July, 2017 - May, 2018

The Process
1.
Discover
- Gather information from stakeholders
- Analyze existing products
2.
Define
- Define features
- Align features with user needs
- Organize workflows
- Develop data architecture
3.
Design
- Ideate data visualization
- Create and iterate wireframes
- Challenges
- Create/design high-fidelity prototype
4.
Deliver
- Test and deliver
1. Discover
Gather Information from Stakeholders
Due to restrictions on contacting potential end users directly, the design team cannot conduct primary research. Therefore, we reach out to marketing team to learn about users needs and they have access to potential enterprise clients.
Analyze existing products
Meanwhile, to get a better understanding of data visualization and device management, I conducted research on existing IoT products and weather applications. Here are the key takeaways:
Module design
Different types of weather data are displayed in modules to enhance clarity.
Real-time data vs. historical data
Real-time data and historical data are separated for convenient monitoring.
Linking and brushing
Different data types can be easily compared
What do users need?
Based on our secondary research, we have concluded below user needs:
1.
Make proactive decisions based on weather changes
2.
Manage multiple weather stations efficiently
3.
Coordinate multiple users to manage devices
2. Define
Define features
According to aforementioned user needs, we collaborated with the marketing team to brainstorm all possible user scenarios and develop workflows respectively.
Prioritize features
We then worked with the engineering team to evaluate all features to ensure feasible implementation of them. As we balanced multiple projects, we experienced both labor and resource shortages and realized that it was imperative that we prioritize features and come up with a feasible plan so that we could deliver the product on time. As a result, we came up with a feature list as follows.
Align features with user needs
After rounds of discussion with multiple teams, we agreed to the below comprehensive feature list for the SPOT product line, including the dashboard, mobile Apps and API.
1.
Historical data
Enable users to check historical data collected by SPOT devices.
2.
Real-time data
Give users an overview of current hyper-local weather conditions.
3.
Device management
Enable users to manage and monitor multiple devices efficiently.
4.
Admin management
Enable multiple administrators to manage SPOT devices.
5.
Device installation
Guide users through installation of SPOT devices in the field.
6.
Weather nowcast/forecast
Help users make proactive and operational decisions by informing them of weather changes.
Features across platforms
We distributed features to our three products according to their characteristics.
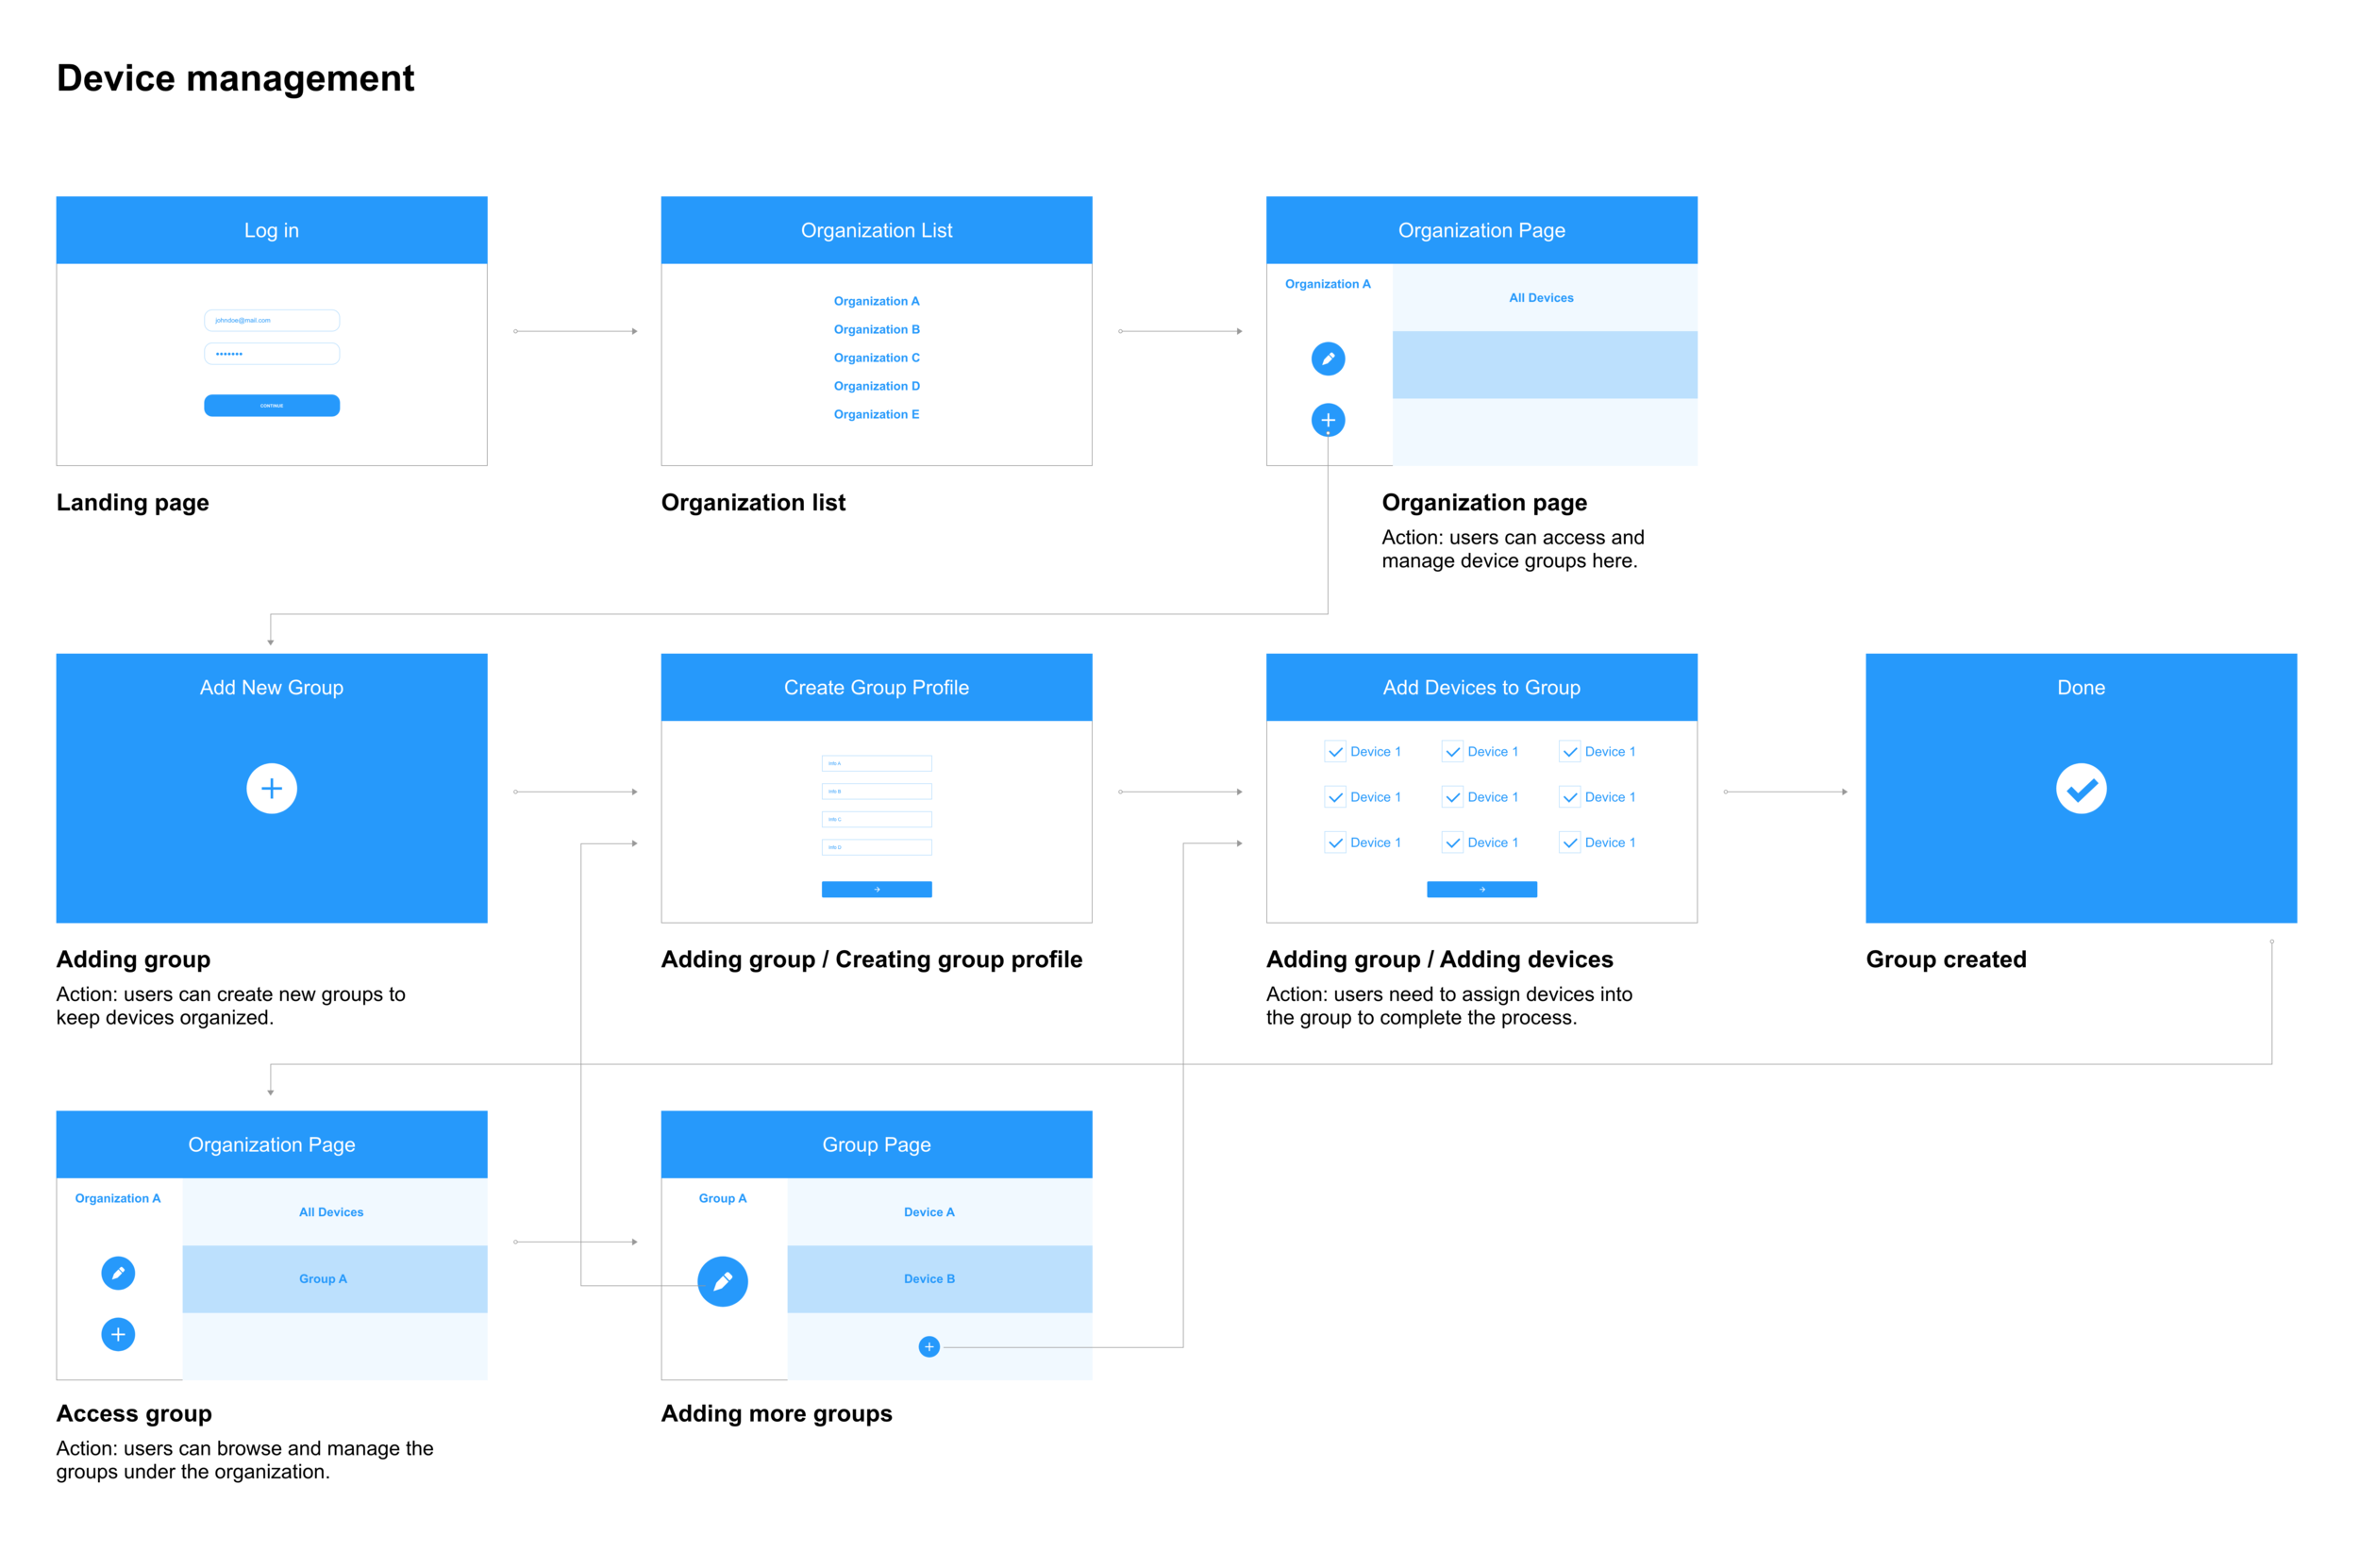
Organize dashboard workflows
After finalizing all features, we started to develop workflows for each scenario. A clear workflow helped keep the team on the same page.
Real-time data
Show users current weather conditions.
Historical data
Store historical weather data for users analysis and downloading.
Device management
Help users monitor and manage multiple devices.
Admin management
Coordinate multiple users to manage SPOT devices.
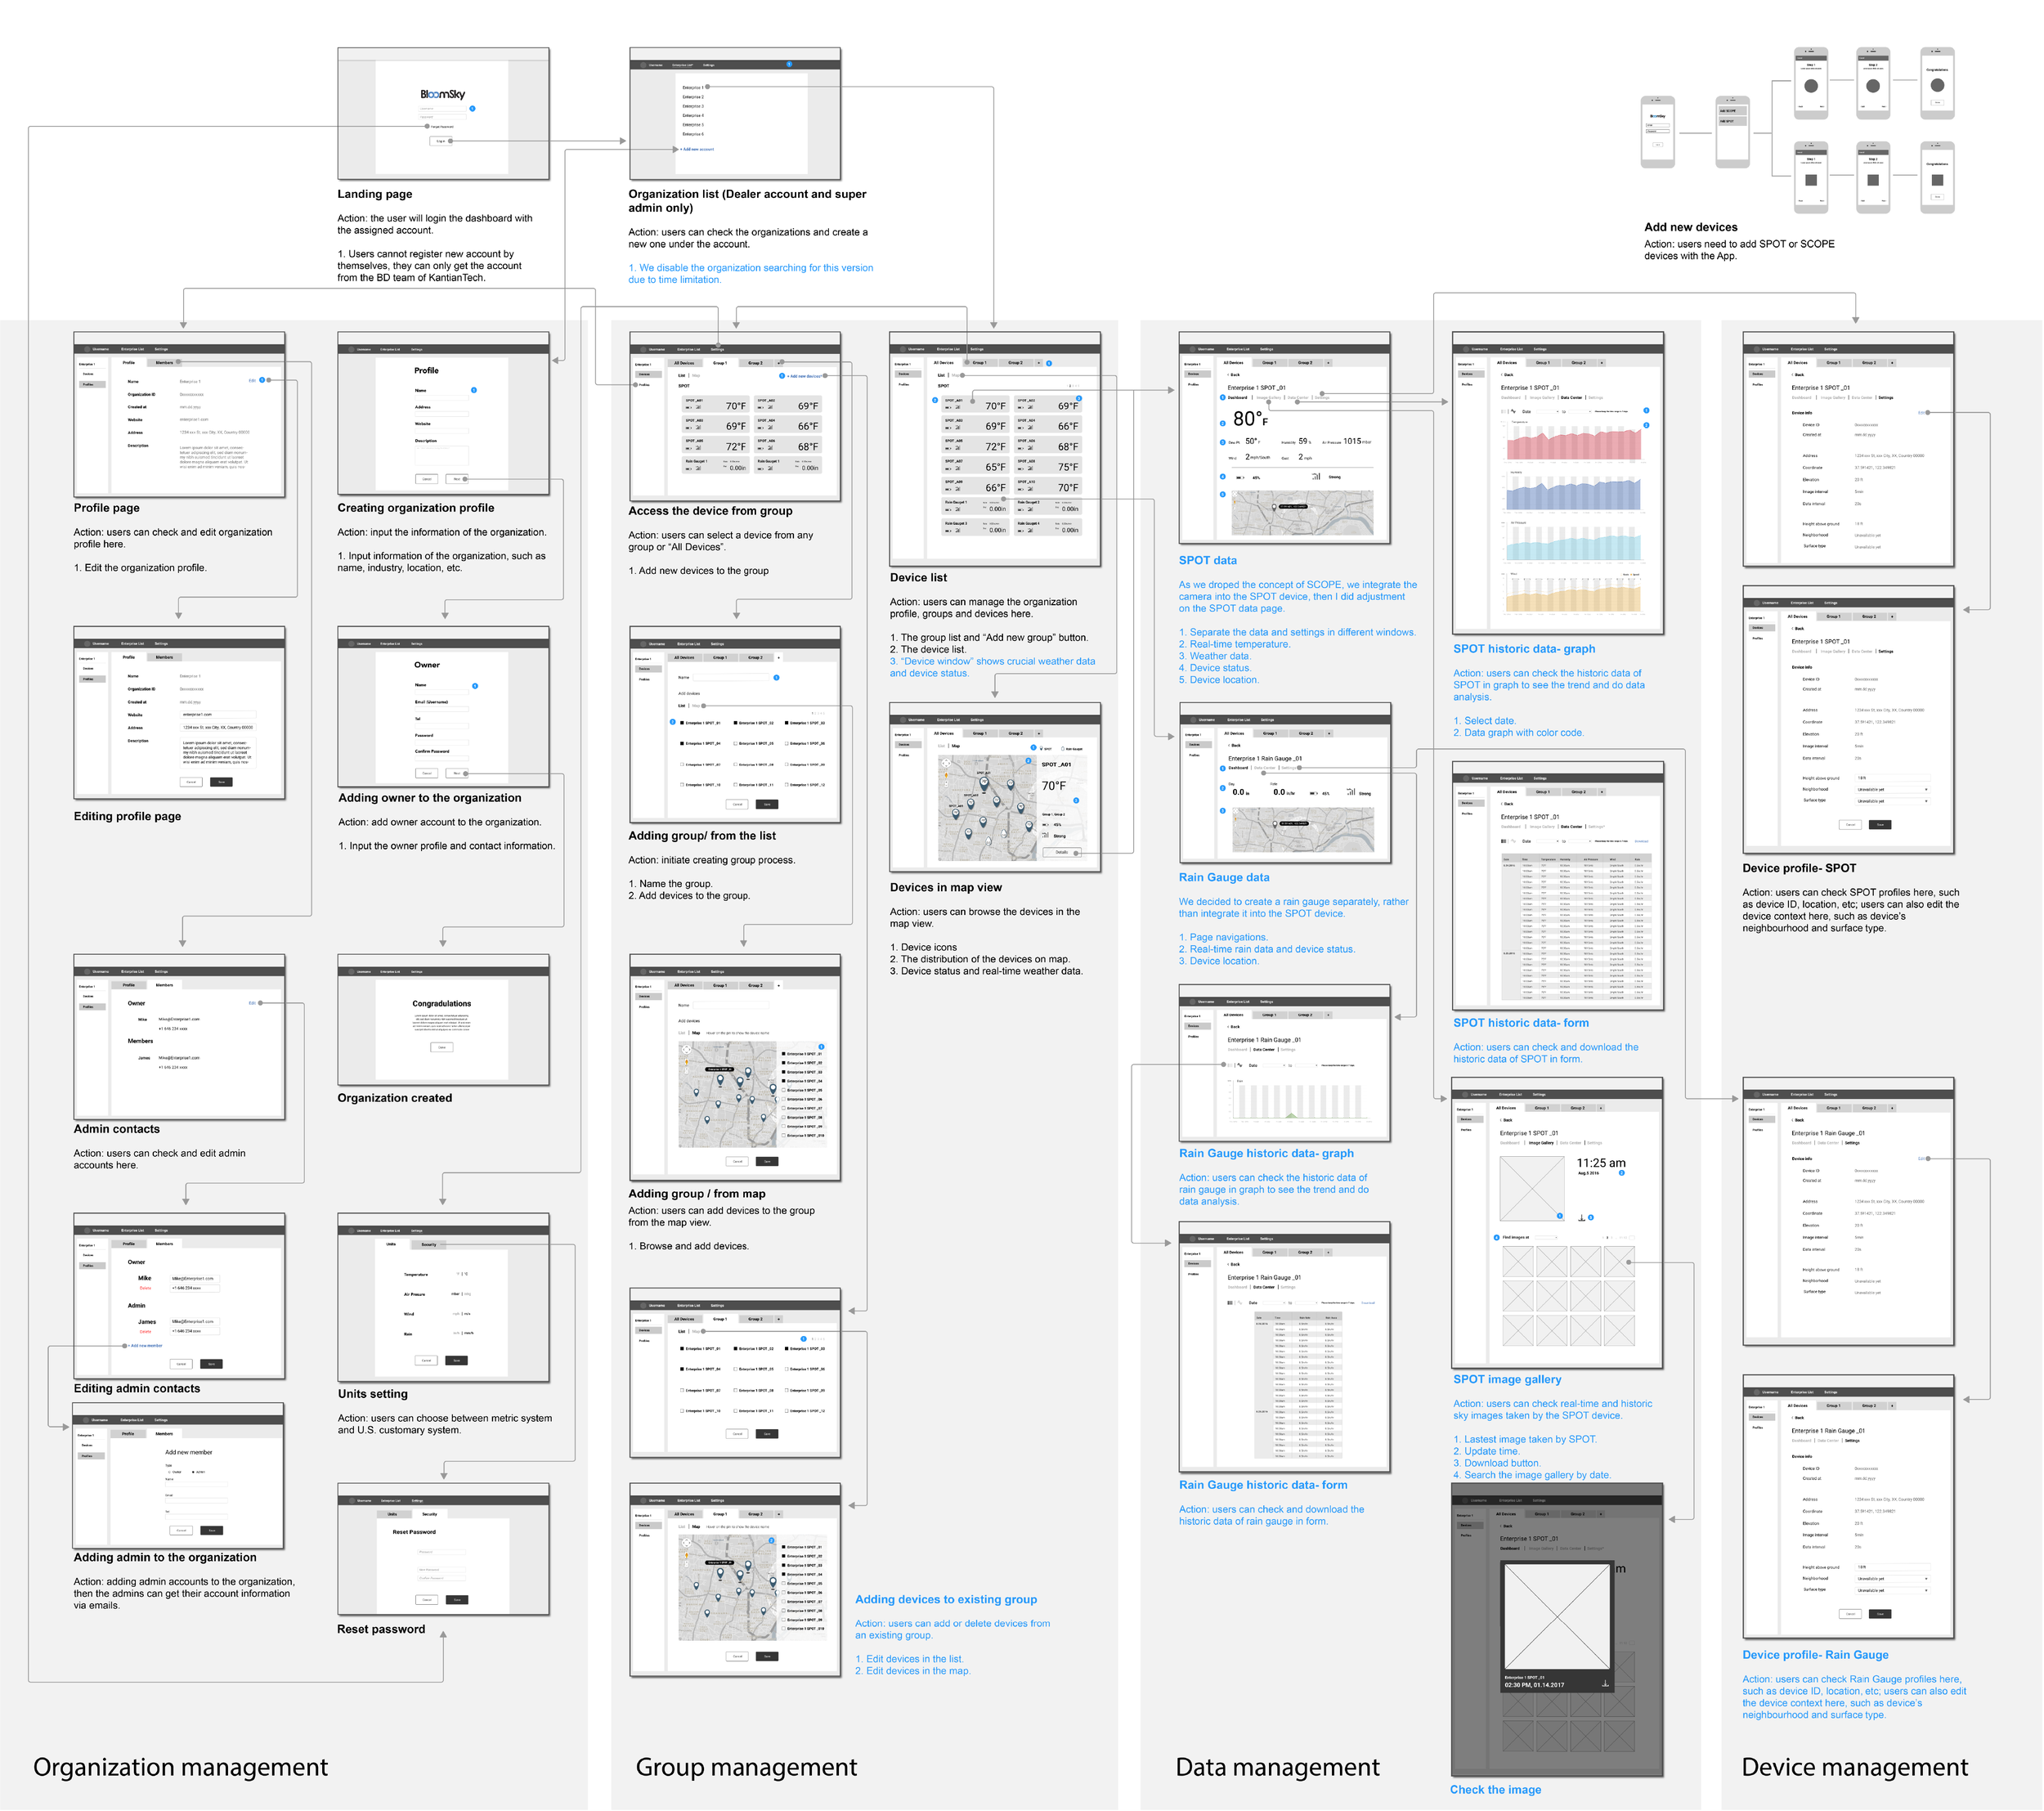
Develop data architecture from workflows
By combining all workflows, we created this info architecture to demonstrate the structure of the product. It helped the whole team stay on the same page as well as prepare the back-end team to build data structure accordingly.
3. Design
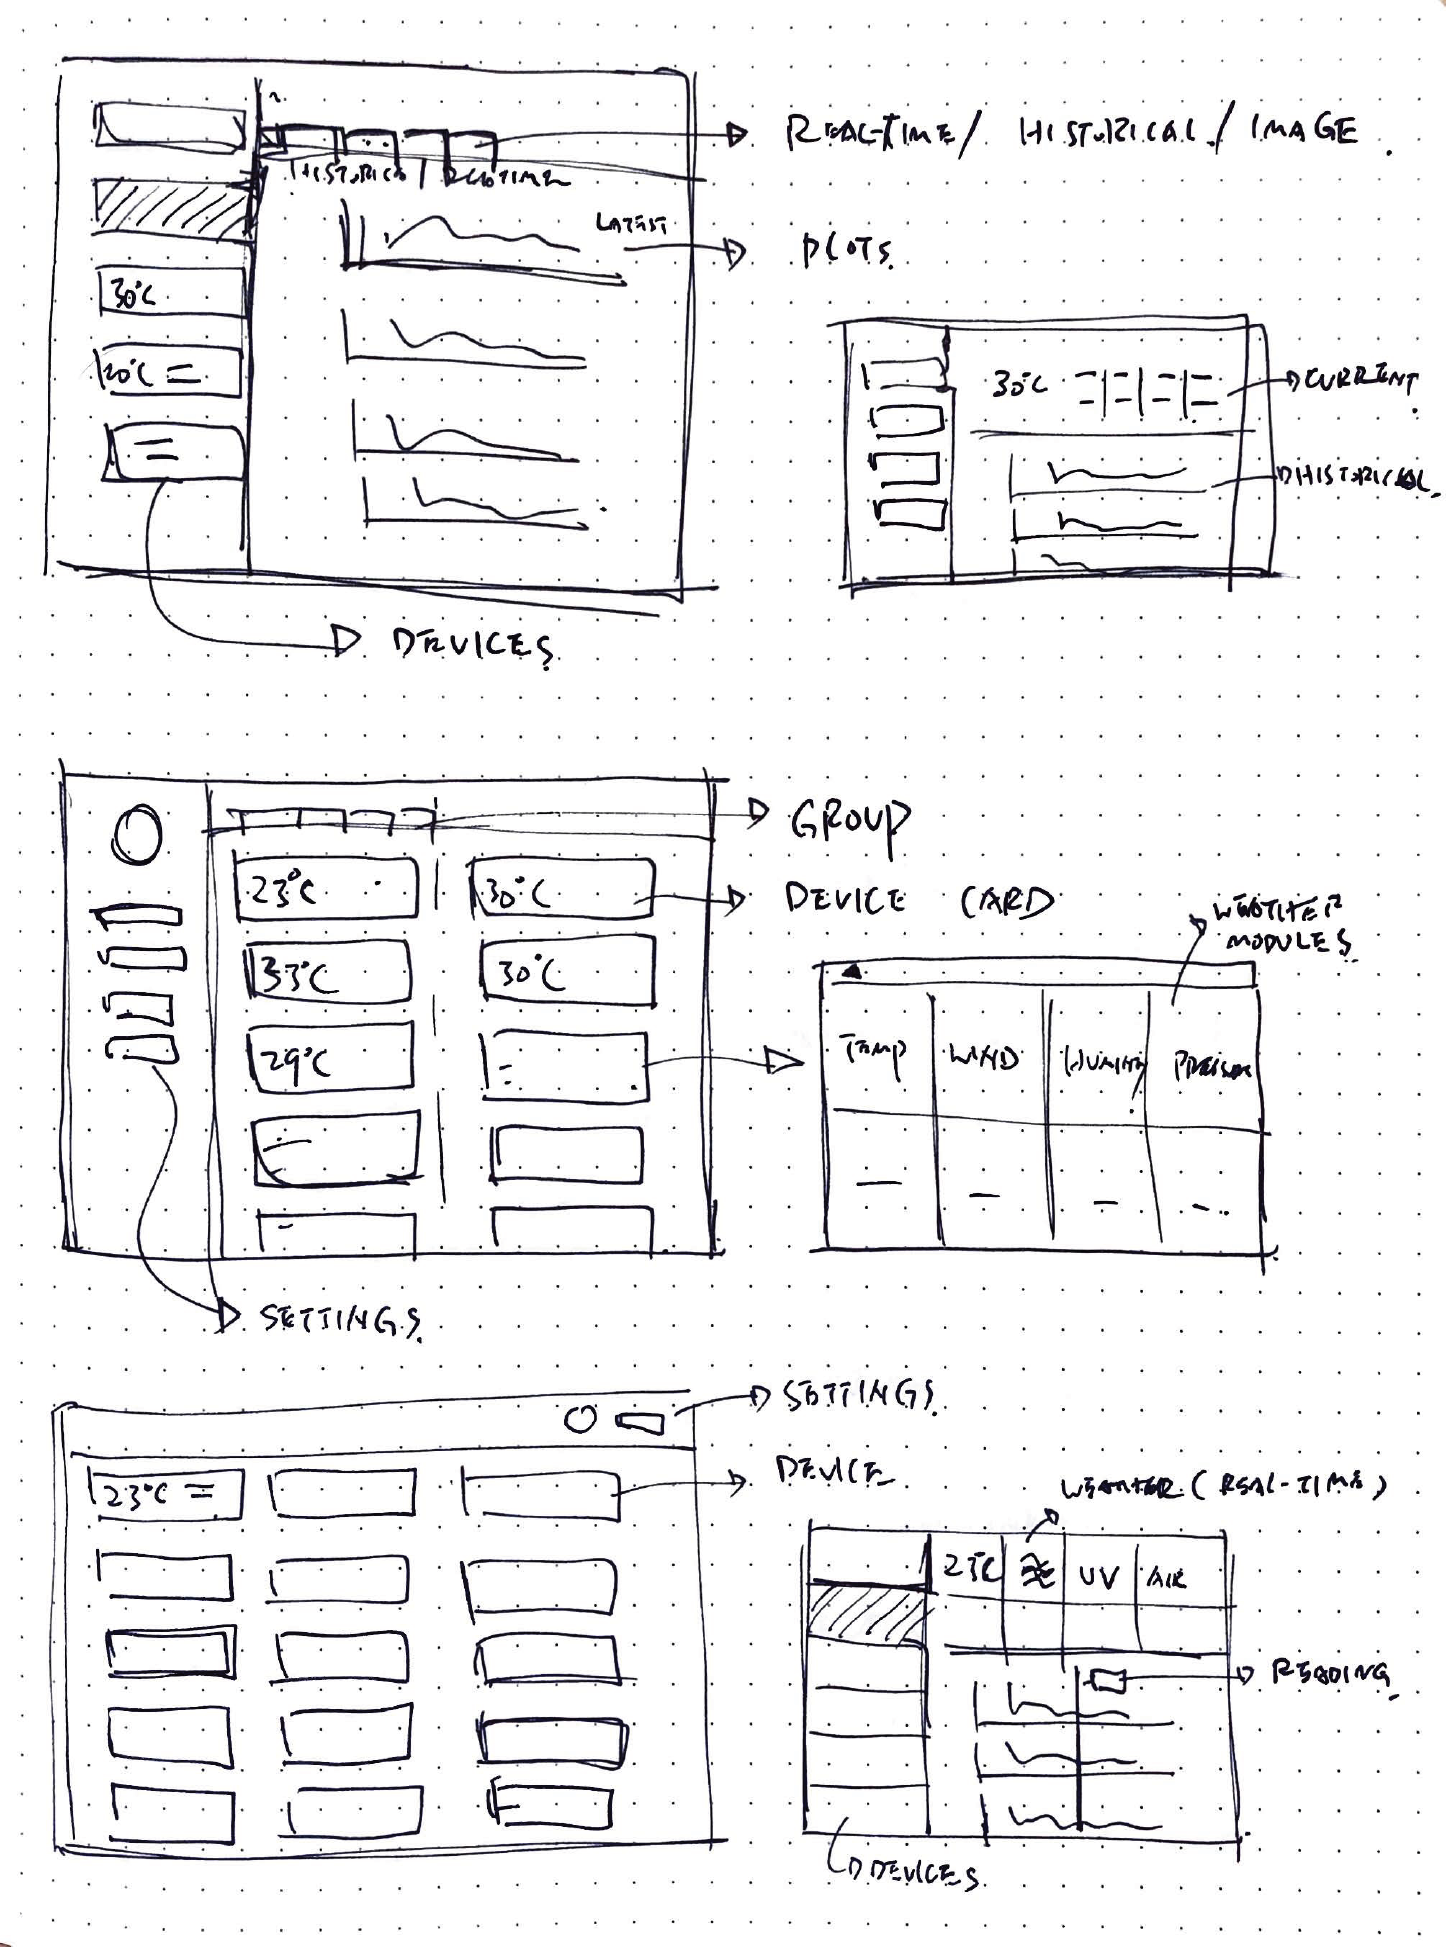
Ideate data visualization
As the mix of different types of data caused difficulties in data presentation, we explored various ways of data visualization with sketches to ensure a clear presentation of all data.
Create and iterate wireframes
From the above sketches, we were able to create wireframes of the dashboard. Wireframe was a powerful tool that was also conductive to keeping different teams on the same page. We conducted a usability test and evaluated the feasibility of features with the help of wireframes. On the other hand, as the hardware development and dashboard design were carried out simultaneously, any changes to the hardware design would affect the dashboard's function. Therefore, we kept updating the wireframe design according to feedback from different teams.
Challenges
1.
Balance between features and stability
While we designed for the product, we faced the potential trade-off between feature variety and data transfer stability. For any IoT product, stable data transfer is critical, so we needed to keep this in mind throughout the process.
2.
Limited access to users
We rarely had chance to speak directly to users. Instead, we could only rely on secondary research such as searching online and reaching out to our marketing team to gain more knowledge about user needs.
3.
Multi-threaded development
The development of hardware, dashboard, and mobile App was simultaneous. Any changes in a product may affect the functionality of the others. Therefore, we needed to consider the big picture when designing.
4.
Communication among multi-disciplinary teams
Multiple teams were involved in the development of this product. As the designer, I played the role of liaising among different parties and make sure everyone was on the same page, which required me to always keep the big picture in mind.
5.
Limited time and resources
As the only designer for the product, I was responsible for the design of the hardware, dashboard and mobile App. An effective time management was crucial in multi-tasking.
Create high-fidelity prototype
Real-time weather data
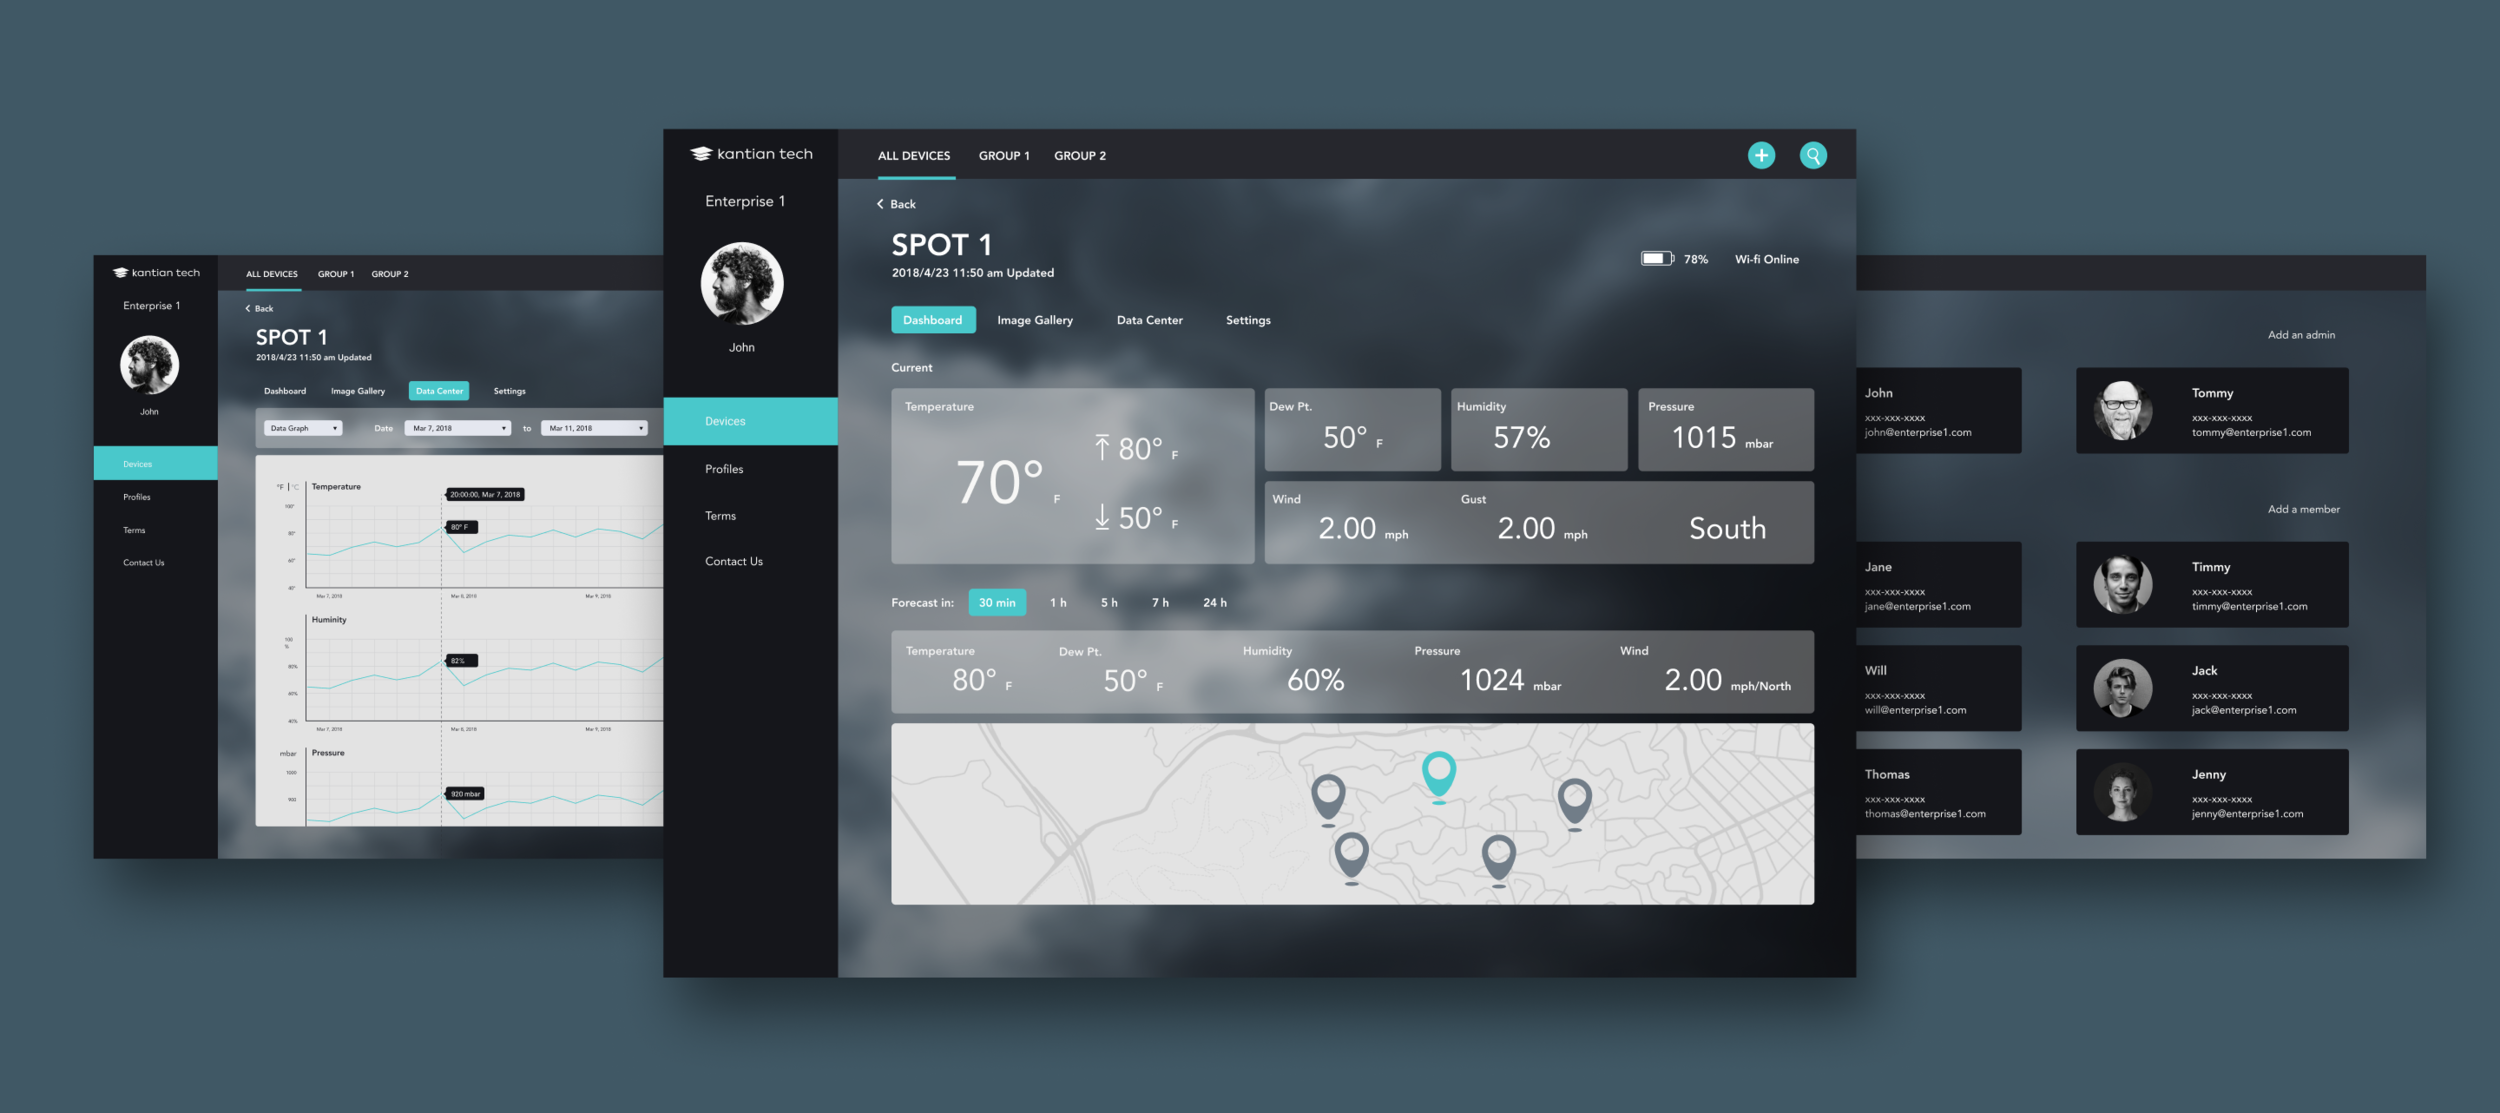
The real-time data and weather nowcast on this page inform users of the current and upcoming weather conditions. Based on the information, users can make operational resolutions to gain benefits or avoid losses.
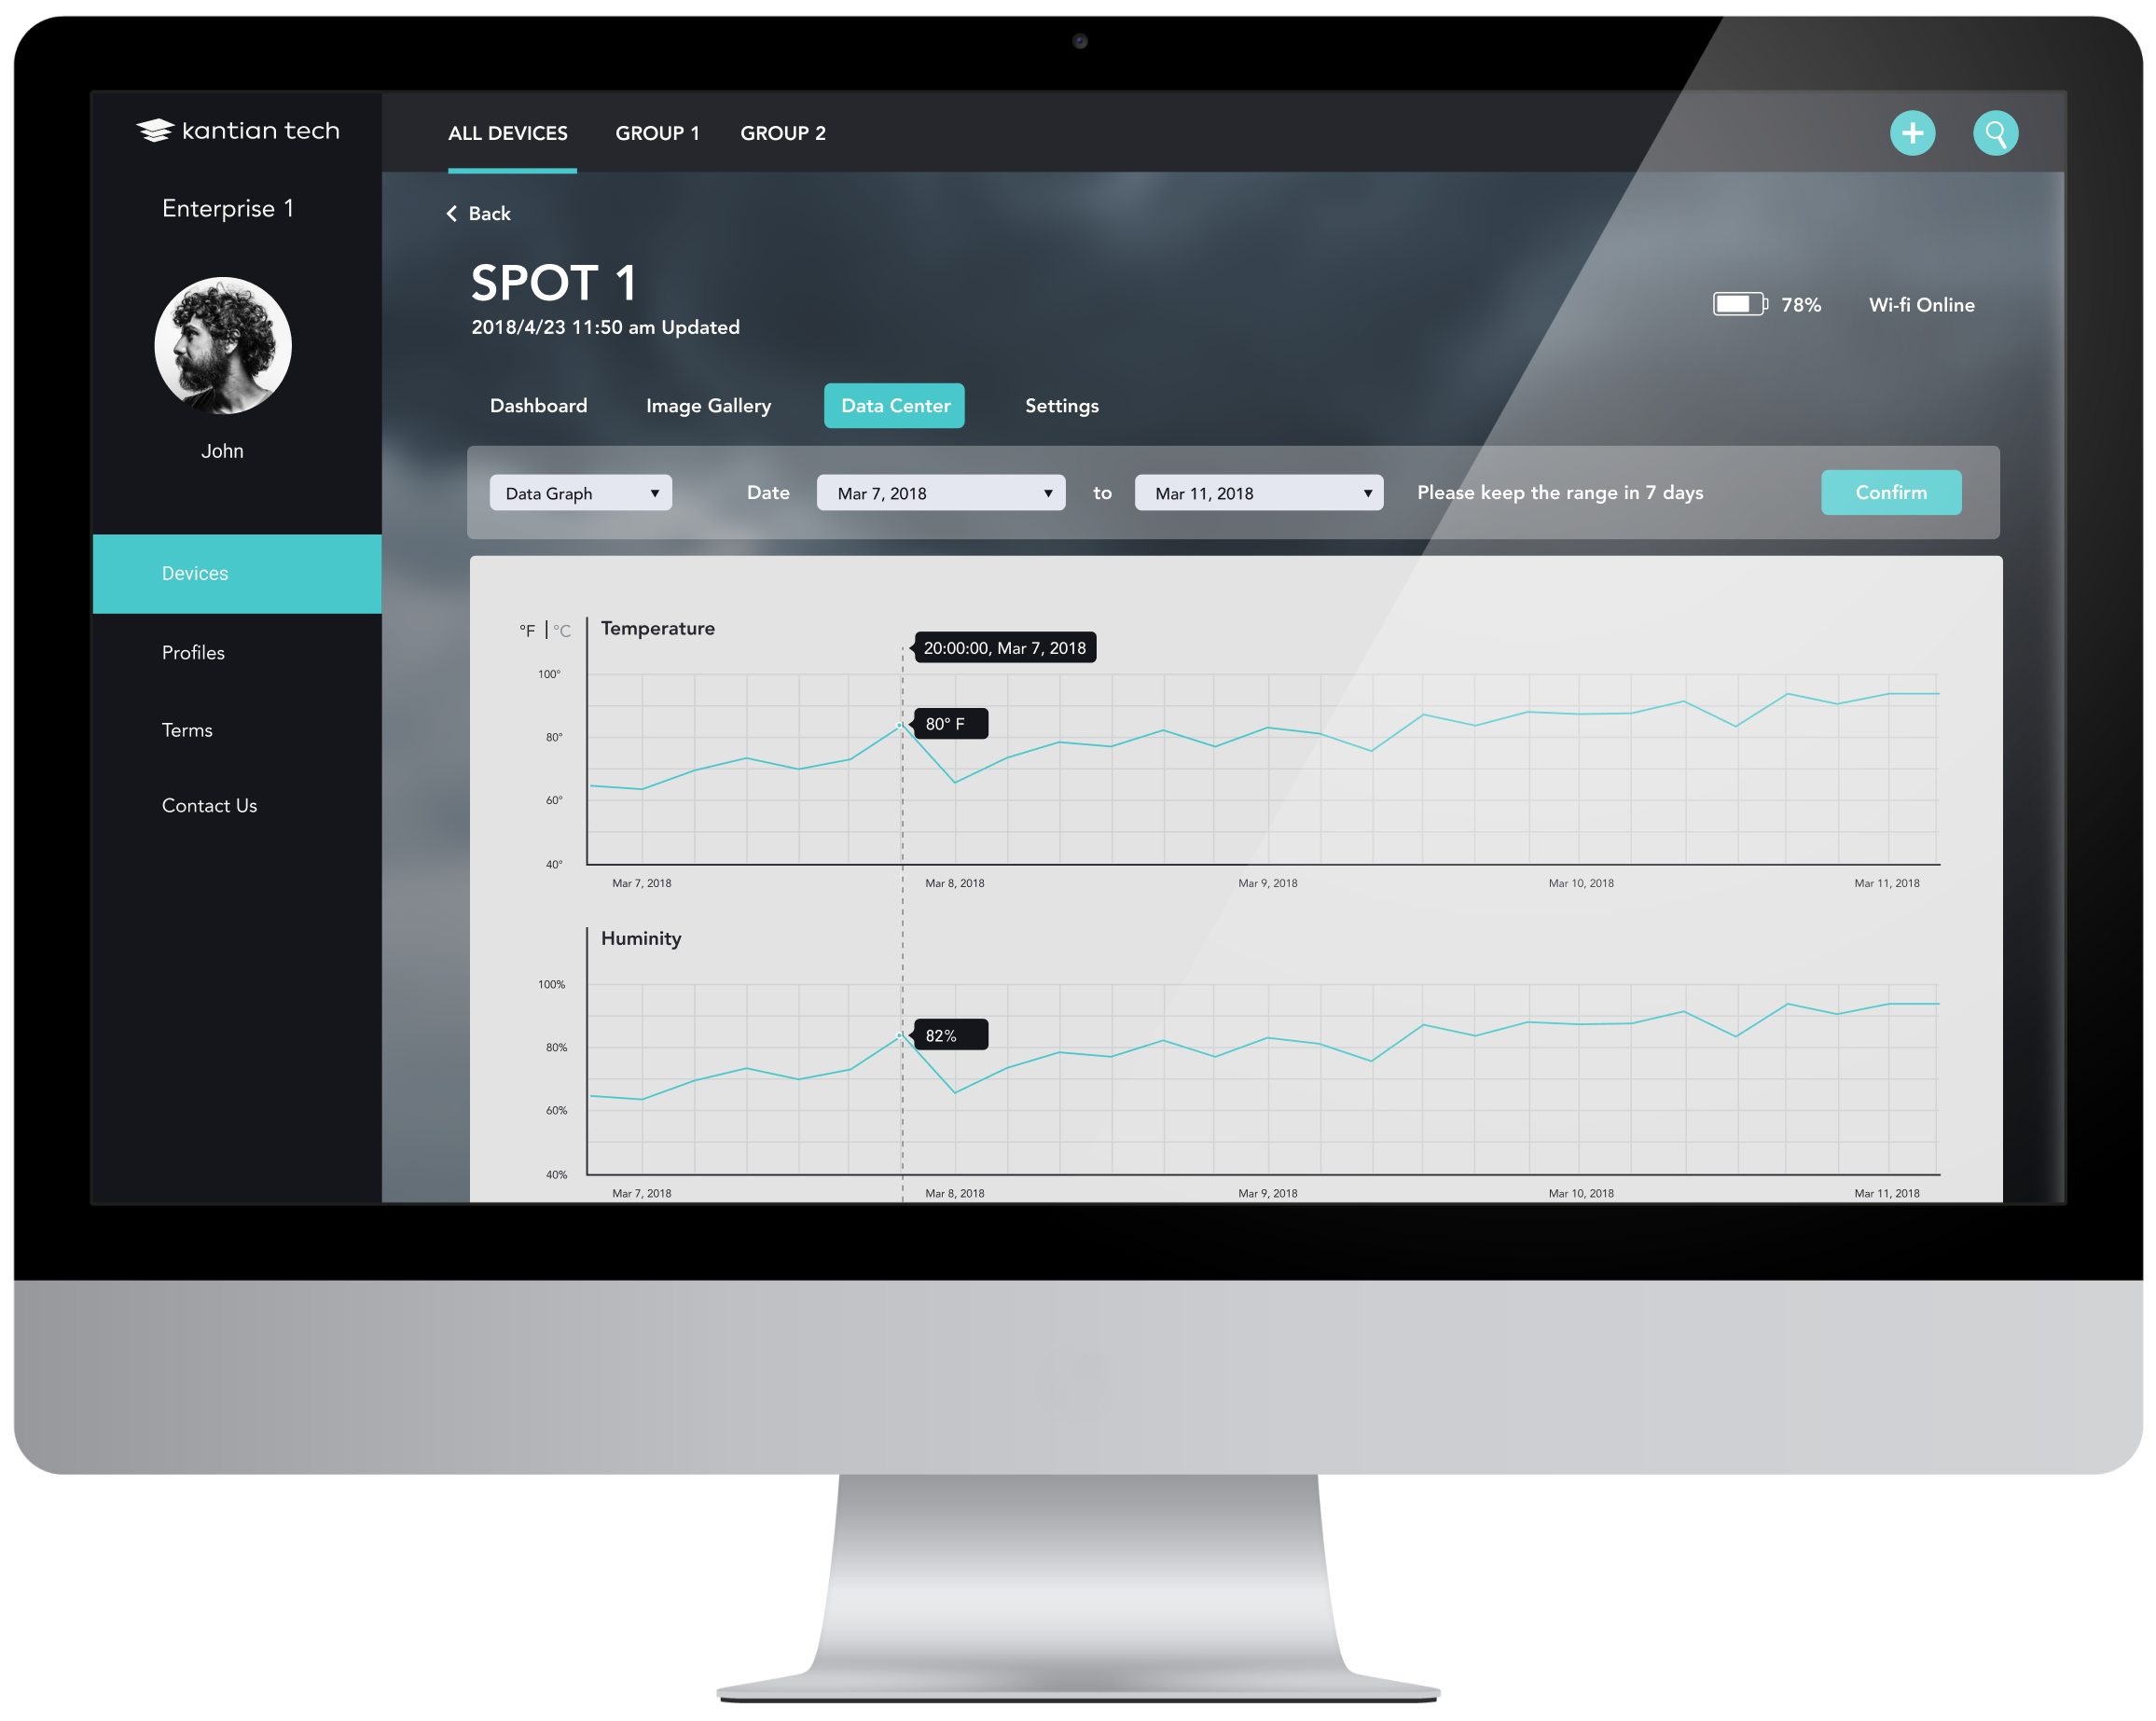
Historical data
The historical data enables users to learn about how weather could potentially affect their businesses. Users can either simply check historical data on the dashboard or easily export them for other usages.
Device management
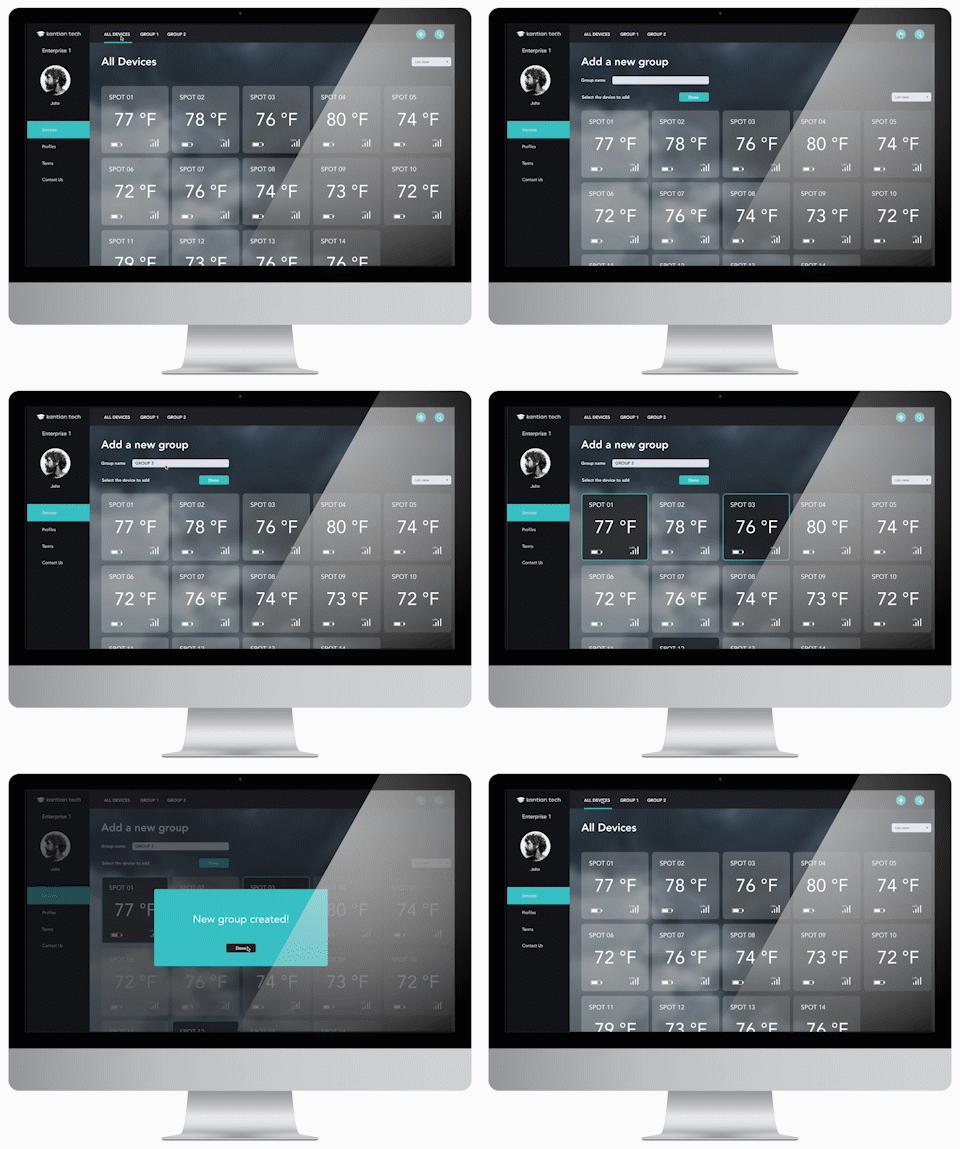
By grouping devices, users can monitor and manage multiple devices conveniently.
Admin management
The admin management feature coordinates multiple users to manage devices seamlessly. Different levels of authority in place can guarantee the security of the system.

4. Test and deliver
After all prototypes, including the hardware, the dashboard and the mobile Apps, were ready, we conducted the field test to make sure they worked properly and interacted well with each other. As the first batch of our enterprise users was mostly agriculture and green energy businesses in China, we handed over the product to colleagues in our China branch for usability test and further improvement.
Impact
Within two years of product launch, three industry leaders from precision agriculture, the solar industry, and smart city are using weather services of SPOT. Meanwhile, several provincial-level meteorological departments in China are integrating SPOT to their systems to improve weather forecasting accuracy.
Reflection
It was such a grand experience for me to be able to work with a multi-disciplinary team consisting of front-end and back-end engineers, data analysts, meteorologists, hardware and firmware engineers. Not only did I learn from my co-workers’ expertises, I also honed my skills on how to collaborate with others more efficiently and make the best informed and balanced decisions during the development process within the timeframe and resources available.


